Machine learning is a such a deep and complex subject that you could spend decades studying it. However, I wanted to see how fast I could get up and running with some ML tools and solve a simple classification problem.
I set out searching for software with three criteria in mind:
- It had to be free.
- It had to be easy to use.
- It should allow me to train a model using a CSV or other simple format.
I found an application called “Orange” which uses visual workflows. This looked promising so I downloaded v3.21. Installation was simple but took a really long time. I just followed the prompts and went with all the defaults except for unchecking the “learn more” boxes.
I wanted to train a machine learning model with data from a file, so the first thing I did was to drag a File component onto the canvas and double-clicked on it. The default file is “iris.tab”, and opening it in a text editor revealed that it’s a simple, tab-delimited file with information about different kinds of Irises. This is a subset of a famous Iris data set from 1936.
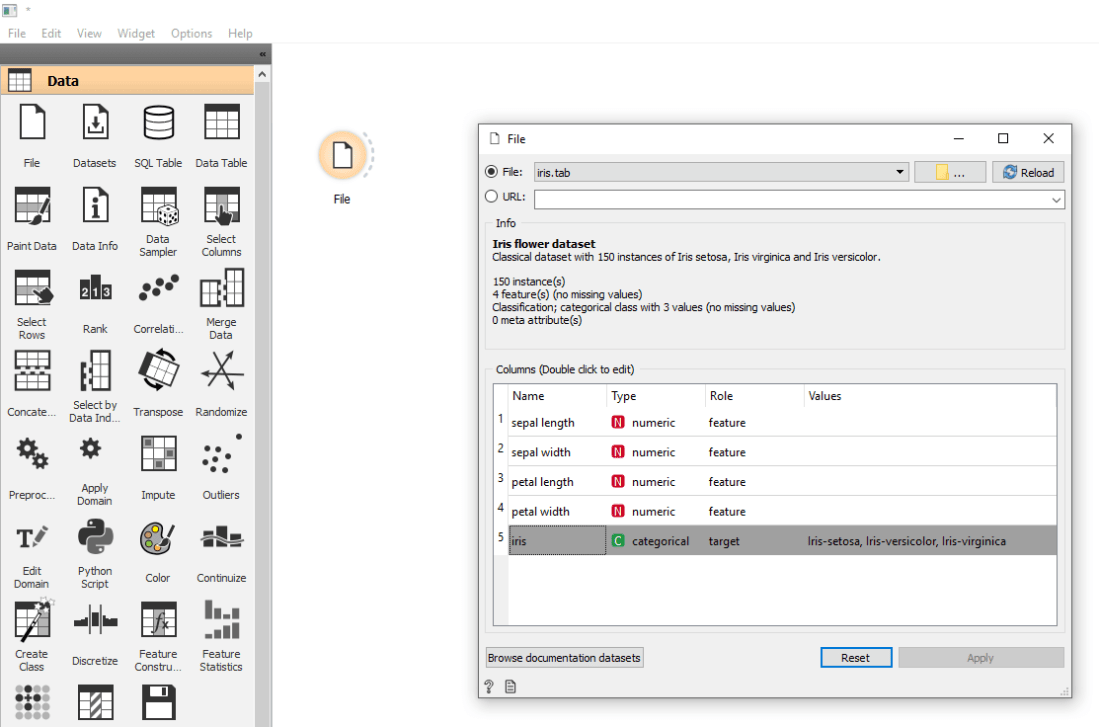
The first three lines of the file are header data, and they are explained in the documentation: “The first row lists attribute names, the second row defines their domain (continuous, discrete and string, or abbreviated c, d and s), and the third row an optional type (class, meta, or ignore).”
A quick Google search tells us that continuous data is any numeric value within a range, and discrete data is limited to certain values. This makes sense when you look at the values in each column.
The “iris” column, which indicates the species of Iris, has a “class” attribute. In the Orange UI it has a role of “target”. I take that to mean that this is the value we’re trying to guess from the features (the other columns).
Sooo… what can we do with this? I wanted to train a model from the data, so I went and placed a Neural Network widget onto the main canvas. Then I clicked and dragged to create a channel between the two widgets. I noticed by hovering over a widget you can see the inputs and outputs.
Neural Networks output models, which is great, but how do we use a model to make predictions? There is a Predictions widget under Evaluate but it takes predictors, not a model. I tried it anyway and it seemed to work.
Finally I needed a way to view the predictions. Based on screenshots of Orange workflows, I deduced that I wanted a Data Table. So far, so good, but the link between the Predictions and Data Table was dashed which meant something was missing. That something was test data to predict from.

I made a copy of iris.tab and deleted the iris column. I deleted all but a single row for each type of iris. Then I took this predict-irises file and hooked it up to the predictions widget. Now how do I run this thing?
I saw a pause button but no play button which suggested that the workflow runs automatically. I opened the Data Table and the NN’s predictions were displayed! It also showed columns for each class with a number between 0 and 1. Based on the numbers shown, I’m guessing this is a confidence value.
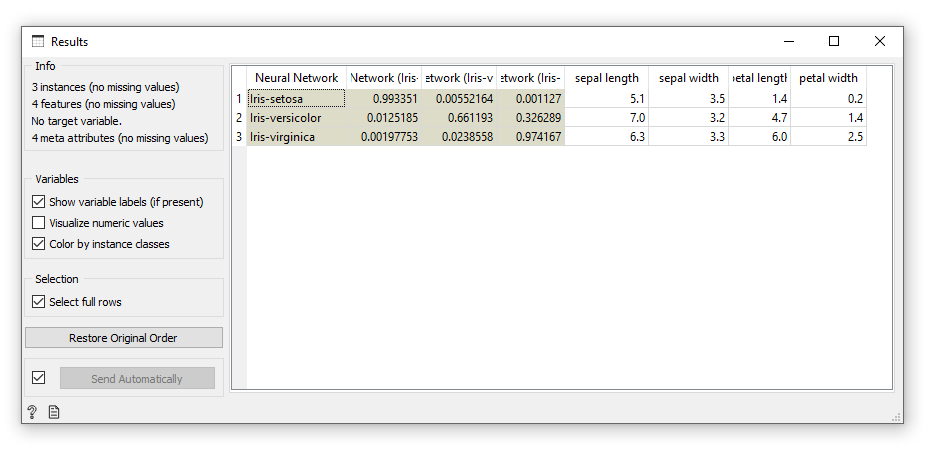
All the predictions were correct, but this is hardly surprising. That’s because the test data was part of the training data. A much better test would be to remove rows from the training file and use those only in the test. So I went back and removed the first row of each type of iris from the training set and placed those specific rows into the test file. Again the prediction was flawless. Impressive!
Next I wanted to try my own problem. I came up with the idea of guessing the language of a word. There would only be one feature – the word itself – and the target would be the language that word belongs to. I found a website with large lists of words in several languages. I downloaded files for German, Spanish, French, Italian, and English.
Preparing your data is an extremely important part of effective data mining (perhaps the most important part), so I wrote a tool in C# to pre-process the word lists. I pared each one down to a reasonable size by only selecting six-letter words, which I thought was a good average length that would have enough information to train on. Then I removed all words that were duplicated across languages and randomized the word order. Finally, I created the Orange file header and wrote the results to two separate .tab files. One file had 5000 rows for testing, and the other 30,000 or so would be used for training.

At this point I encountered a problem: Orange can’t use string values as features. So I had to break each word down into individual letters, where each letter would be a feature. I left the full word in as metadata so I could easily read the results. I built a workflow just as before and it worked! I made a neural network that could guess the language of a word!

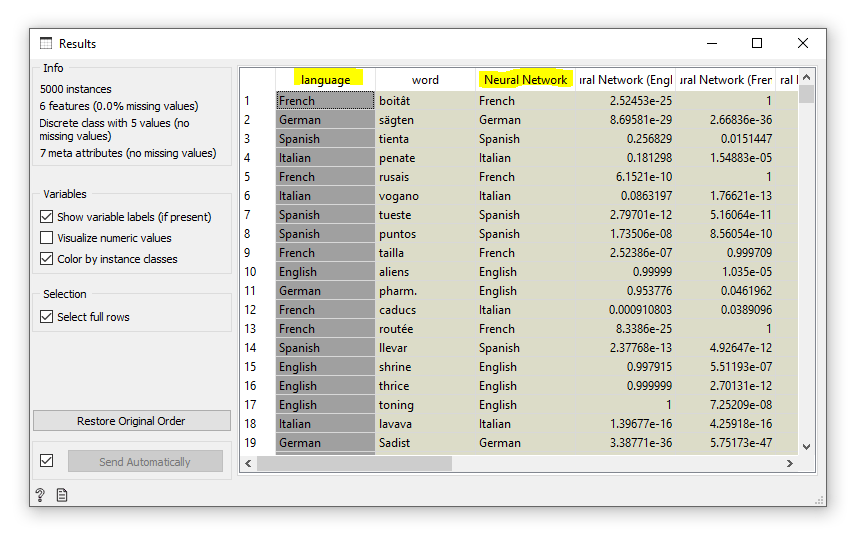
The “Neural Network” column shows the model’s prediction.
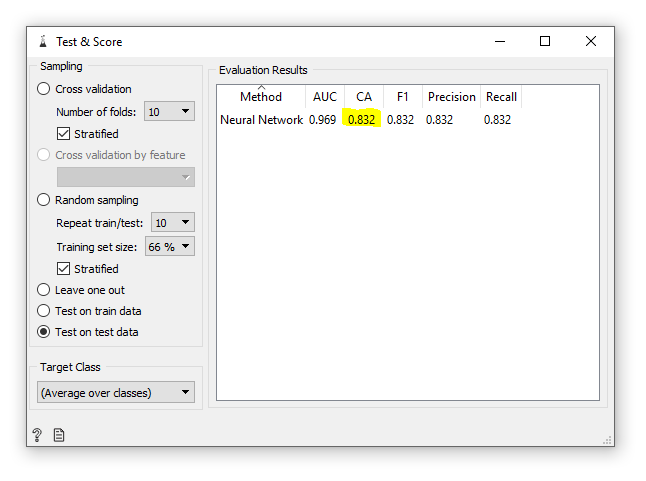
There was one more thing I wanted to do, and that was to automatically score the accuracy of the results. I added a “Test & Score” widget and wired up the necessary inputs. The final result was an accuracy of 83.2%. Not bad at all!
In this experiment I found that Orange is a great visual tool for machine learning and it’s really fun to use. With the exception of a couple of crashes that may have been caused by human error, it ran very smoothly. Even with all the settings at their defaults, I was able to create a working neural-network-based solution with good accuracy.
I’ve only scratched the surface of Orange’s functionality, and I look forward to discovering what other amazing things it can do.
